Two Digital Divides, Not One: What ITU's Facts and Figures 2025 Says About Connection Versus Technology Tier
The ITU published “Measuring Digital Development: Facts and Figures 2025” on 17 November 2025, and its headline number moved in the right direction: 2.2 billion people remained offline in 2025, down from 2.3 billion in 2024, as the global online population rose from 5.8 billion to 6 billion. That is real progress on the indicator ICT4D research has tracked longest — whether a person has any internet access at all.
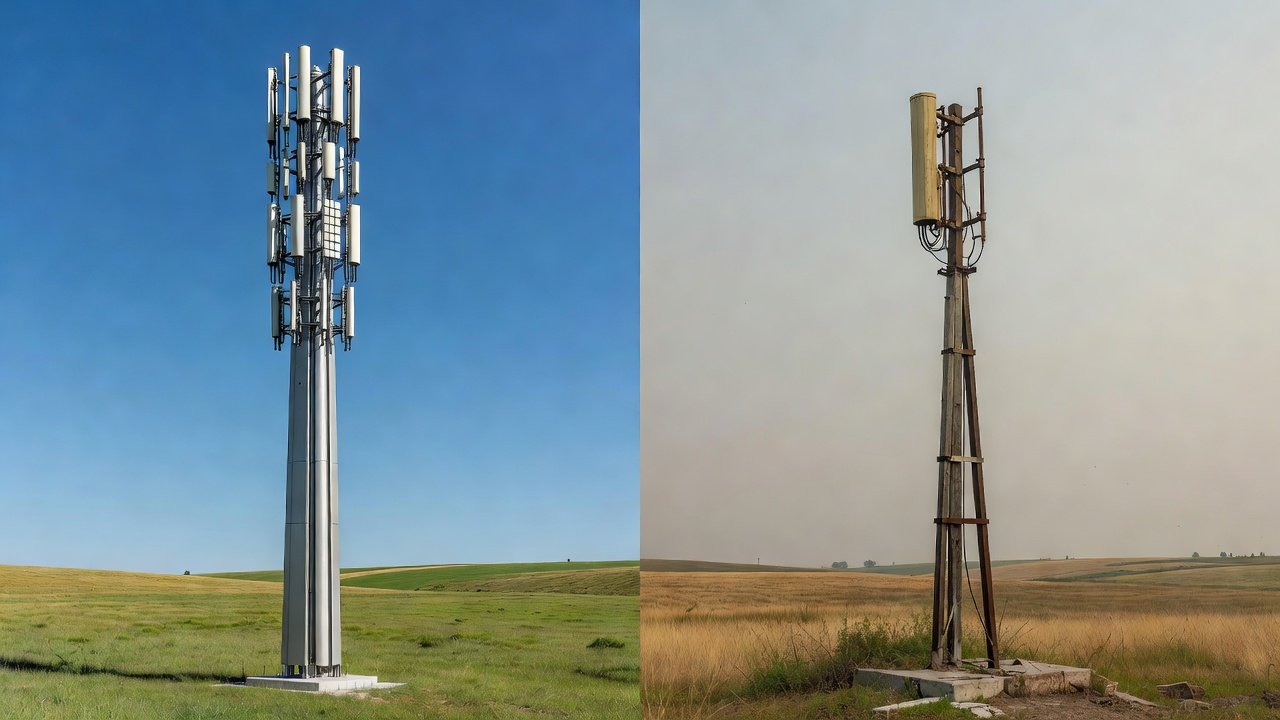
The same report also documents a second gap that the connection-count framing does not capture. Among people who are connected, the technology available to them diverges sharply by income level: 5G networks cover 84% of the population in high-income countries and 4% in low-income countries, and a typical mobile user in a high-income country generates roughly eight times more data than one in a low-income country. This is not the same divide as the connected/unconnected split, and treating it as a footnote to that split understates what has changed.
The connection divide is narrowing, slowly
The basic-access numbers are worth stating precisely because they are frequently rounded into vaguer claims. Internet use rose from 71% of the global population in 2024 to 75% in 2025, an increase of roughly 240 million users in a single year. The unconnected population fell by 100 million, from 2.3 billion to 2.2 billion. Mobile broadband network coverage is now close to universal in the sense that a signal reaches most of the world’s population; the remaining gap is concentrated in populations that live within range of a network but do not use it, and in populations in the small number of countries and areas where coverage itself remains thin.
The report also breaks the 2025 figures down by other dimensions worth citing directly: internet use stands at 94% in high-income countries against 23% in low-income countries, 85% in urban areas against 58% in rural areas, and 77% among men against 71% among women globally. These gaps have each narrowed over the past decade, at different rates, and none has closed.
The technology-tier divide is a different measurement problem
The 5G figures describe something the connected/unconnected count cannot see. A person counted as “using the internet” in a low-income country and a person counted as “using the internet” in a high-income country are, on average, using substantially different technology: different generation of mobile network, different achievable speed, and by the report’s own data, a very different volume of data consumption per person.
This matters for research design because the two gaps respond to different interventions and move on different timelines. Basic coverage expansion — the intervention that has driven most of the progress on the connected/unconnected count over the past two decades — is a network-buildout problem: towers, spectrum, backhaul. Closing the 5G-coverage gap between high- and low-income countries is a capital-intensity problem of a different order, since 5G deployment requires denser infrastructure and different spectrum bands than the 3G and 4G networks that closed most of the basic-coverage gap. A country can plausibly reach near-universal basic mobile coverage on 3G/4G infrastructure while remaining almost entirely outside 5G coverage, and the report’s country-income breakdown suggests this is close to the actual situation for most low-income countries today.
The practical consequence is that “the digital divide” as a single indicator increasingly describes two different phenomena moving in different directions at different speeds, and studies that report only the connected/unconnected figure risk implying the divide is closing faster, and more uniformly, than the fuller dataset supports.
Why the two gaps compound rather than substitute
The two divides are not independent of each other; they interact. The ITU’s data on data-usage volume — the roughly eightfold gap between high- and low-income country users — is partly a direct consequence of the technology-tier gap, since 4G and 5G networks support substantially higher throughput than the 2G and 3G connections still common in the lowest-income markets, and higher throughput availability changes what applications and services people use once connected.
This means a country can improve its connected/unconnected ratio significantly while its population’s usable applications, services, and data-intensive opportunities (video-based education content, cloud-hosted services, data-heavy government platforms) remain constrained by the technology tier available to them. Two countries can report identical progress on the standard connectivity indicator while one is delivering meaningfully more capability to its newly connected population than the other. The ITU’s report frames this directly, noting that digital divides are increasingly defined by speed, reliability, and affordability rather than basic access alone — a framing shift from earlier editions of the same statistical series, which weighted the access indicator more heavily.
Gender and geography cut across both divides
The report’s disaggregation by gender and by urban/rural residence applies to both gaps, and the compounding effect is visible there too. Rural populations and women are less likely to be connected at all, and where they are connected, they are more likely to be on lower-tier networks and older, less capable devices — a pattern documented across the ICT4D literature on gendered technology access rather than specific to this year’s ITU release. A rural woman in a low-income country sits at the intersection of the geographic, gender, and technology-tier gaps simultaneously, which is a different research object than “the unconnected.”
What this means for citing the digital divide
For researchers and donor program officers, the practical implication is to specify which divide a claim or a proposed intervention addresses. A connectivity project measured by subscriber counts or coverage percentage is addressing the access divide; it is not, by itself, addressing the technology-tier divide, and its logframe should not silently conflate the two. Conversely, a proposal to extend 5G or fixed broadband to underserved regions is a technology-tier intervention that does little for populations who remain entirely unconnected. The ITU’s own 2025 dataset gives researchers the disaggregated figures needed to state which gap a given piece of evidence actually speaks to, and the two-gap framing is now explicit enough in the ITU’s own release that continuing to cite a single “digital divide” figure without specifying which one is a citation choice that costs little to correct.
The ITU’s Facts and Figures 2025 statistical release provides the full country-income and demographic breakdowns behind these figures for anyone building a proposal or a literature review on either gap.